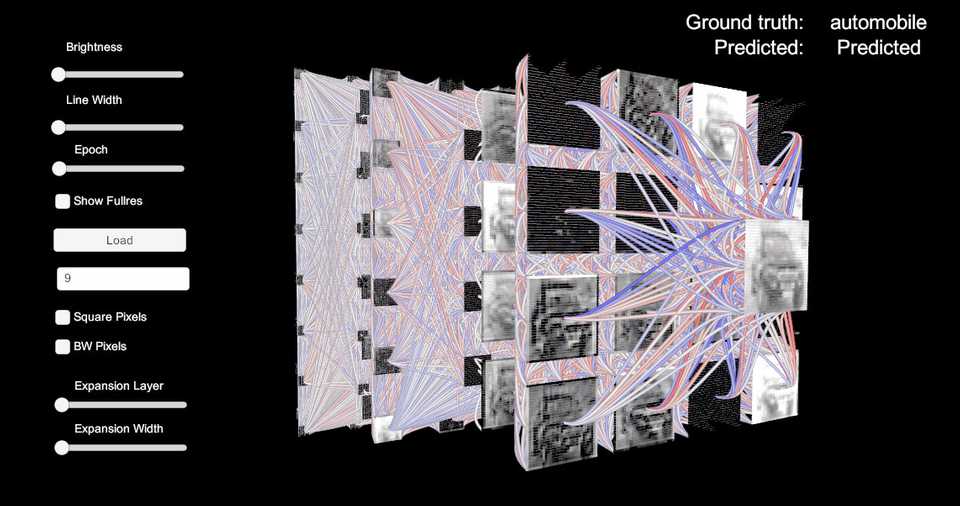
 Image: Screenshot of realtime visualization interface.
In summer semester 2018 I attended the combined lecture/excercice „Visualization 2“ at my university, where we were assigned to implement a visualization based on one of various suggested papers, but we also had the possibility to implement an own idea if we preferred that.
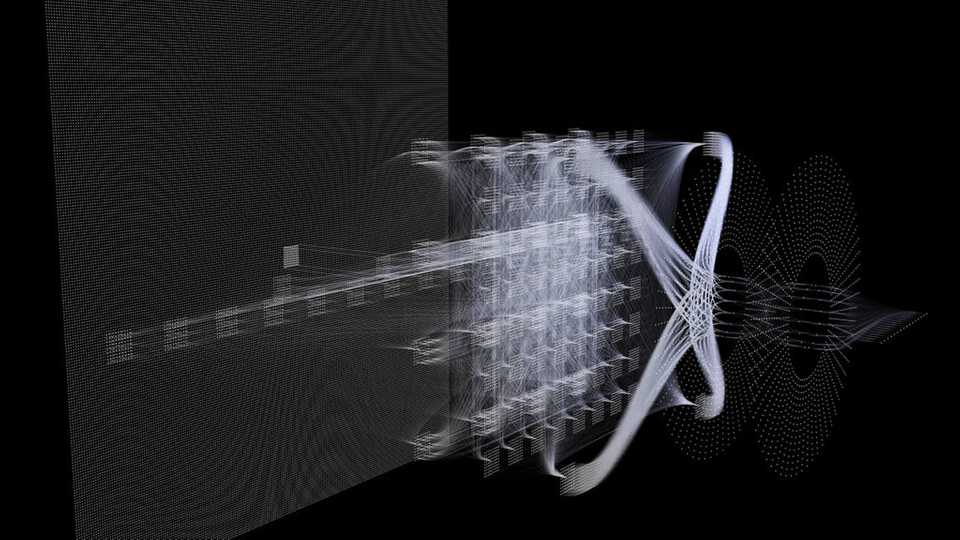
The CNN Visualizer is something I’d had in my mind for some time already, but never had a reason to actually sit down and implement it, but for this lecture it was perfect. I wanted to create a 3d visualization of a Convolutional Neural Network showing all of the connections between layers of these models, to give a person new to this field a good visual overview of the interdependency. The implementation has been done in the game engine Unity.
 Image: High quality render from prototype in 3d software.
When submitting the project for University the functionality included visual representations for convolutional, max-pool and fully connected layers with various reduction mechanisms to hide connections in favour of a clearer visualization. Also I ‚d built a python script that trains a CNN in tensorflow and exports a json file which then can be read by the CNN visualizer automatically reconstructing the network and assigning colours to the neurons and connections according to the weights and activations. A More detailed description can be found here: http://visuality.at/vis2
The project got quite positive response (won „best project“ award of the lecture, also got a lot of attention on Reddit).